Physarum urban
research into slime mold capabilities with AI
I studied the slime mold Physarum polycephalum as an algorithm, testing it on real city maps with AI. Here is what I think holds up.
What it is
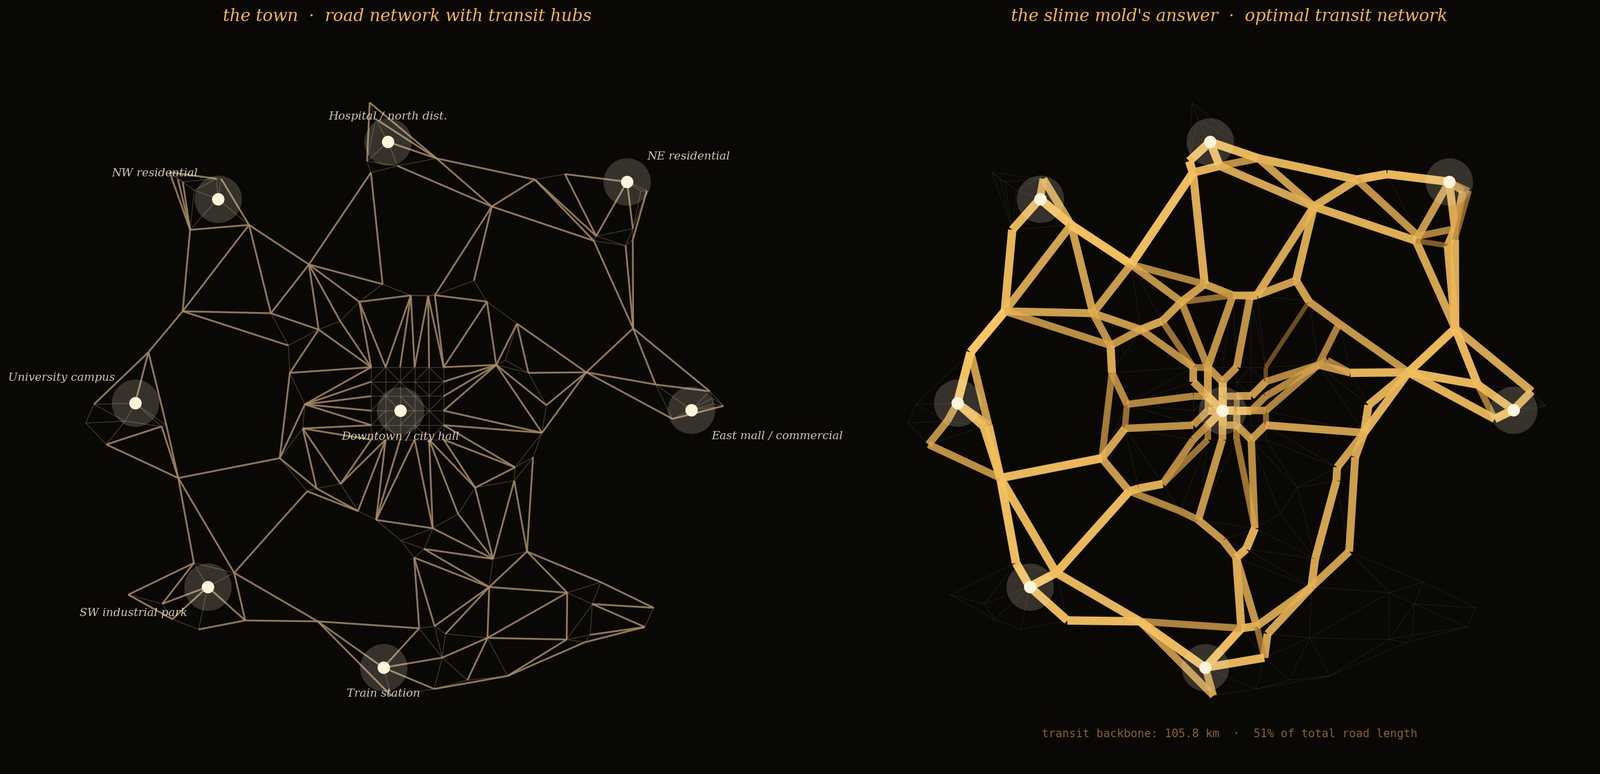
Physarum is a single cell with no brain. Tubes carrying flow thicken and unused ones shrink, leaving a short network with backup routes. In Tero et al. (Science, 2010) it linked oat flakes placed like towns around Tokyo into a network comparable to the region's rail system.
What it could do
- Transit backbones. It shrinks a street map to a ranked backbone, and one setting slides it from lean to redundant.
- Finding weak points. It ranks links by the flow they carry, which my ARIA project used to flag the bridges a supply network leans on; cut one and it reroutes.
- Routing around obstacles. Pipes and wiring through crowded space are a possible use: a 2022 slime-mold-inspired method wasn't slowed by obstacles, though it wasn't tested head-to-head.
- Growing parts. Fed at load points, it grows a frame along the load paths; my 3D-printable drone frame has only a rough hand calculation behind it so far.
- Paired with AI. Claude turns a goal like "avoid flooding" into solver settings, then drafts the write-up.
What I built
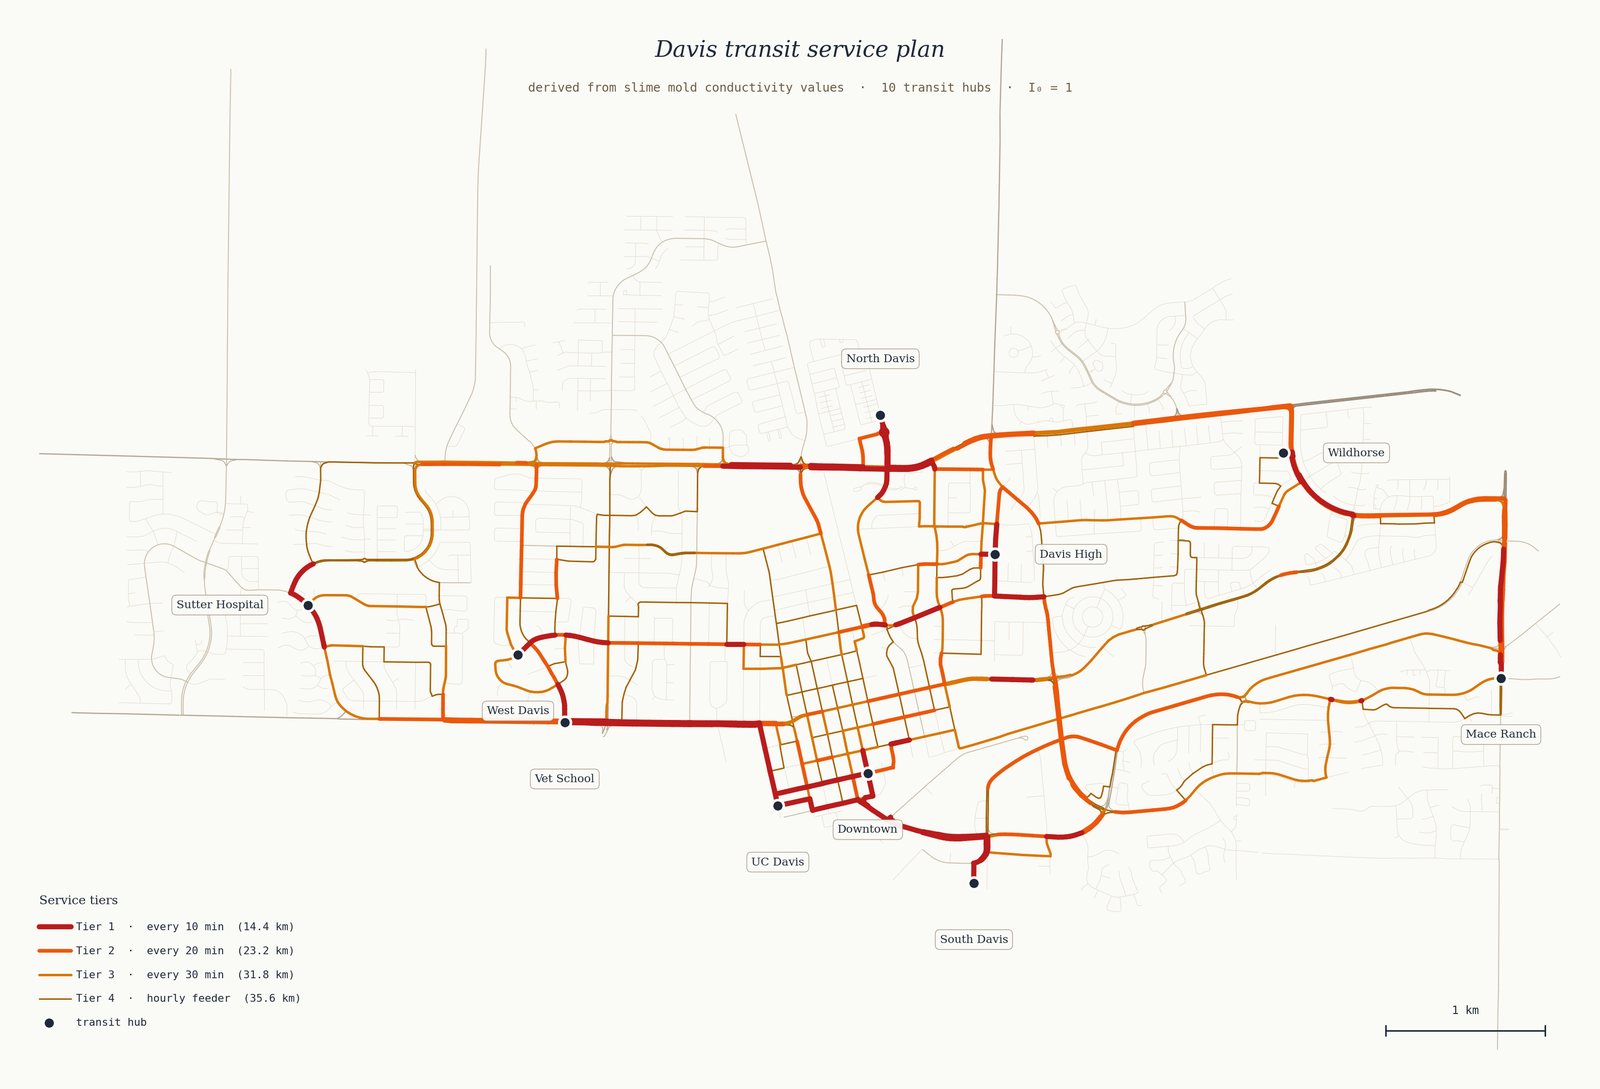
- In Davis, California, I cut 301 km of OpenStreetMap roads to a 105 km lean or a 167.5 km redundant backbone.
- A flood-aware bike plan for Somerville and Medford, Massachusetts. Closing every street that touches the 100-year floodplain leaves about 28% of homes with no route to any Green Line Extension station, mostly because it closes the Mystic River bridges.
The catch
I found no verifiable case of a transport agency adopting a Physarum design, and the Tokyo result shows two optimisers agreeing, not biology beating engineers. It skips most of real planning, its fault tolerance has only been tested against random breaks, I haven't compared it head-to-head with a standard Steiner-tree method, and the AI memo once mixed up two of my numbers.